DMA of 2026 APRIL 20 MONDAY AMC.
Pervical has left the island for an emergency. Minimal Market Data will be posted. He should be back in a few days.
— Automation Penguin
The stock market started the week on a subdued note following last week’s push to record highs, as mega-cap and tech names saw some profit-taking amid renewed geopolitical uncertainty.
The S&P 500 (-0.2%), Nasdaq Composite (-0.3%), and DJIA (flat) spent the session drifting modestly below their flatlines as investors reacted to mixed reports regarding the state of the next round of talks between the U.S. and Iran.
Stocks opened modestly lower in reaction to weekend developments that seemingly put the talks on hold, and moved to session lows shortly before midday after President Trump told Bloomberg that it is “highly unlikely” he will extend the current ceasefire if a deal is not reached this week.
However, the major averages quickly rebounded from their worst levels amid reports that delegates from both the U.S. and Iran will travel to Pakistan to engage in talks this week.
Crude oil futures settled today’s session $5.18 higher (+6.2%) at $89.40 per barrel. While the rise in oil prices coincided with a pullback in select areas of the market, particularly recent leaders, crude remained below the $90 per barrel mark, signaling a degree of stabilization.
Sector strength was mixed and variable throughout the session, though weakness across mega-cap and tech-heavy sectors kept the major averages from making a move into positive territory.
The communication services sector (-1.4%) was the worst performer, as Meta Platforms (META 670.91, -17.64, -2.56%) and Alphabet (GOOG 335.40, -4.00, -1.18%) provided poor mega-cap leadership, while Netflix (NFLX 94.83, -2.48, -2.55%) declined further and failed to attract buy-the-dip interest following disappointing Q2 guidance in last week’s earnings report.
The consumer discretionary sector (-0.7%) was another laggard, with Tesla (TSLA 392.49, -8.13, -2.03%) moving lower ahead of its own earnings release this week, while cruise lines and other oil-sensitive names retreated today.
Meanwhile, the information technology sector (flat) made a steady move higher throughout the afternoon, which saw it finish flat for the day. Intel (INTC 65.70, -2.80, -4.09%) was a notable laggard, but the PHLX Semiconductor Index (+0.5%) still managed a modest gain.
Elsewhere in the sector, computer hardware names such as Hewlett Packard Enterprise (HPE 27.82, +1.38, +5.22%) and Dell (DELL 204.25, +7.70, +3.92%) outperformed, while solid gains across software stocks pushed the iShares GS Software ETF 1.4% higher.
Additionally, Apple (AAPL 273.05, +2.82, +1.04%) was a mega-cap standout.
Late improvements to the information technology sector helped both the major averages and the Vanguard Mega Cap Growth ETF (-0.4%) finish considerably improved from their worst levels, though it was not enough to extend the Nasdaq Composite’s winning streak, which was snapped after an impressive 13 sessions.
Elsewhere, strength was mixed, with five S&P 500 sectors posting modest gains.
The materials sector (+0.6%) captured the widest gain with Steel Dynamics (STLD 209.35, +9.03, +4.51%) finishing as one of the S&P 500’s top movers ahead of its earnings release, while the financials sector (+0.3%) was supported by broad strength.
The S&P 500 Equal Weighted Index (+0.3%) outperformed the market-weighted S&P 500 (-0.2%), reflecting solid participation under the surface.
All told, it was a relatively quiet Monday session. There was some renewed geopolitical uncertainty coming out of the weekend, but the market’s muted reaction suggests investors continue to view a more durable ceasefire as the base case, despite elevated near-term uncertainty. Growth stocks took a modest step back after a strong rally, but the major averages remain just below recent record highs. While the market continues to monitor U.S.-Iran developments, attention is set to shift more firmly toward earnings as reporting season ramps up this week, with investors looking for continued growth and forward guidance to sustain the recent momentum.
There was no economic data of note today.
U.S. Treasuries began the week on a slightly lower note with the market showing limited concern over a weekend speedbump on the path to a peace deal with Iran. The 2-year note yield settled up two basis points to 3.72%, and the 10-year note yield finished unchanged at 4.25%.
BENCHMARK INDICES YEAR-TO-DATE
- Russell 2000: +12.5% YTD
- S&P Mid Cap 400: +11.0% YTD
- Nasdaq Composite: +5.0% YTD
- S&P 500: +3.9% YTD
- DJIA: +2.9% YTD
MARKET INTERNALS
- DOW closed lower at 49443 (-0.01%).
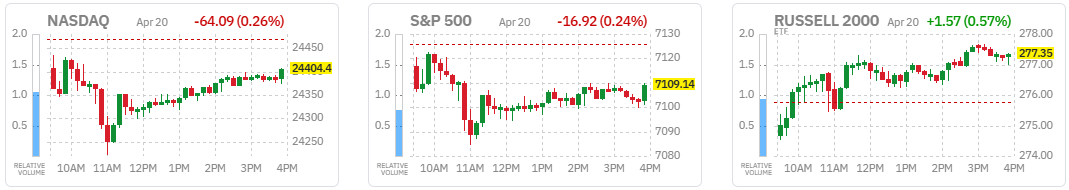
- Nasdaq closed lower at 24404 (-0.26%).
- S&P 500 closed lower at 7109 (-0.24%).
- Action came on lower than average volume (NYSE 1,088 mln vs avg. of 1,399 mln; NASDAQ 8,451 mln vs avg. of 9,186 mln),
- Advancing/declining volume for NYSE (590 mln/478 mln) and Nasdaq (4412 mln/3934 mln).
- Advancers led decliners on the NYSE but not Nasdaq (NYSE 1475/1274; NASDAQ 2405/2457)
- New 52-week highs outpacing new 52-week lows (NYSE 141/11, NASDAQ 285/70).
After-Hours Action
Futures
stats
BONDS AND YIELDS
stats
Yields
- 2-yr: -8 bps to 3.70% (-10 bps this week)
- 3-yr: -8 bps to 3.72% (-10 bps this week)
- 5-yr: -8 bps to 3.84% (-10 bps this week)
- 10-yr: -6 bps to 4.25% (-7 bps this week)
- 30-yr: -4 bps to 4.89% (-2 bps this week)
CURRENCIES
stats
Currencies
- EUR/USD: -0.
COMMODITIES
Brent and WTI
The spread between Brent and WTI is currently at $X.XX
Commodities
- Crude Oil +2.


ROTW UPDATES
U.S. ECONOMIC UPDATES
- Briefing Summary
- NEWS
trading econ
EARNINGS SEASON AND GUIDANCE
2026 APR XX
Pre-Market: BOH
After-Hours: None
THE WEEK AHEAD
WEEK 16: MONDAY TO FRIDAY, APRIL 20 to APRIL 24
According to the PTSD*, Week 17 has FIVE trading days and is the LAST trading week in April 2026. The next Expiration Friday is MAY15. The next Market Holiday is on MONDAY MAY25. Seasonally, Weeks 16 and 17 have historically been the most bullish weeks of the year. April is the last of the “6 months of bullishness” on the SPX.
We also need to keep in mind that with the current POTUS, seasonals can easily go out of whack.
*PTSD – Penguin Trader Seasonal Data.
BENCHMARK INDICES (21-YEAR AVERAGE)
The Stock Trader’s Almanac’s stats for the Benchmark Indices for 2026 APRIL XX of Week 17 over a 21-year average are:
- Dow Jones (DJIA): Mildly Bullish 52.4%
- S&P 500 (SPX): Mildly Bearish 52.4%
- NASDAQ (COMP): Slightly Bearish 38.1%
- *Russells 2000 (RUT): FLAT 50.0%
*The RUT is not listed in the STA; several penguins with a slide ruler calculated the 21-year average.
BENCHMARK INDEX ETFs
The Penguin Trader Seasonal Data (PTSD) stats for the Benchmark Index ETFs for 2026 APRIL XX of Week 17 over a 15-year average are:
- DIA – (15yr Avg): Mildly Bullish 52.4%
- SPY – (15yr Avg): Mildly Bearish 44.4%
- QQQ – (15yr Avg): Rather Bearish 30.0%
- RUT – (15yr Avg): FLAT 50.0%
ECONOMIC DAY AHEAD
For USA’s upcoming economic calendar features:
ANALYSIS
A penguin will be volunteered for this post soon, or if incentivised with enough cheese.
COMMENTARY
Say cool stuff
Stay Hedged – My Penguin Friends
(Excerpts from briefing.com, tradingeconomics.com, financialscents.com, factset.com, finviz.com, marketwatch.com, etrade.com, yahoo.com, tigerbrokers.com, tradingview.com, tradingcentral.com, theedgemalaysia.com, sectorspdrs.com, Investopedia.com, and CNBC.com)