WMO of MONDAY to FRIDAY, 2026 APRIL 20 to APRIL 24
The stock market delivered another strong advance this week, with equities moving back into record territory as falling oil prices, improving geopolitical conditions, and powerful leadership from mega-cap and technology stocks drove index-level gains.

The macro backdrop steadily improved throughout the week. While early uncertainty lingered after the U.S. and Iran failed to secure a more durable agreement over the weekend, sentiment shifted as renewed talks were signaled and the existing ceasefire held. By Friday, news that the Strait of Hormuz would reopen during the ceasefire period, along with reports of upcoming negotiations in Pakistan, marked a meaningful de-escalation.
Crude oil responded decisively, extending its weekly decline to roughly $12 per barrel and settling below $85. That sharp drop helped ease inflation concerns and improve the outlook for potential rate cuts, reinforcing a supportive environment for equities.
Against that backdrop, the S&P 500 (+4.5%), Nasdaq Composite (+6.8%), and DJIA (+3.2%) all posted strong week-to-date gains, with the Nasdaq’s significant outperformance underscoring the market’s rotation back into growth and AI-driven leadership.
Participation broadened notably beneath the surface. The Russell 2000 (+5.6%) and S&P Mid Cap 400 (+3.5%) both advanced solidly, with small caps outperforming the broader market as risk appetite strengthened alongside improving macro conditions.
Sector performance reflected a clear risk-on tone. Growth-oriented areas led decisively, with information technology (+8.1%), communication services (+6.3%), and consumer discretionary (+6.6%) posting outsized gains. The iShares Expanded Tech-Software ETF (IGV) surged 13.9% for the week, marking a sharp reversal from prior weakness and reestablishing software as a leadership group.
Semiconductor stocks also contributed meaningfully, with the PHLX Semiconductor ETF rising 7.5%, reinforcing the strength of the broader AI trade. Meanwhile, the Vanguard Mega Cap Growth ETF climbed 7.3%, highlighting the continued importance of mega-cap leadership in driving index-level performance.
Outside of growth, cyclical participation improved as falling oil prices provided a tailwind. Financials (+3.3%) and real estate (+3.8%) advanced, while industrials (+1.2%) posted more modest gains. In contrast, defensive sectors lagged, with utilities (-1.7%) and consumer staples (flat) reflecting reduced demand for safety. The energy sector (-3.4%) was the clear underperformer, pressured by the sharp decline in crude prices.
All told, this week reinforced the market’s strong upward momentum. A combination of easing geopolitical tensions, sharply lower oil prices, and renewed leadership from both mega-cap technology and previously lagging areas has strengthened the foundation of the rally. With participation broadening and key growth segments reasserting dominance, the market appears increasingly well-supported as it pushes deeper into record territory.
BENCHMARK INDICES YEAR-TO-DATE
- Russell 2000: +11.9% YTD +5.6% week-to-date
- S&P Mid Cap 400: +10.3% YTD +3.5% week-to-date
- Nasdaq Composite: +5.3% YTD +6.8% week-to-date
- S&P 500: +4.1% YTD +4.5% week-to-date
- DJIA: +2.9% YTD +3.2% week-to-date
THE WEEK IN REVIEW
Monday:
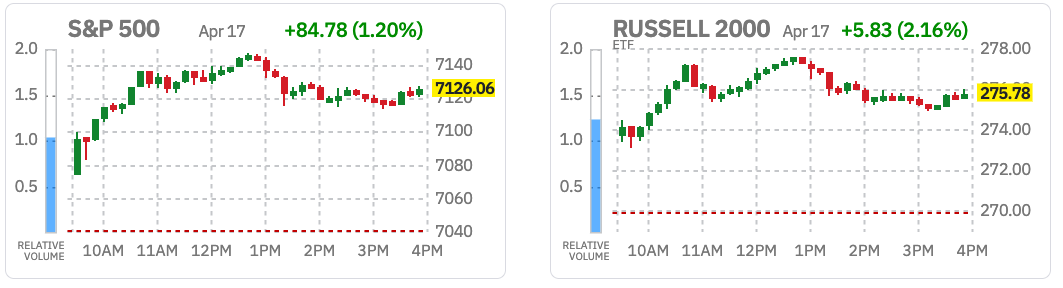
The stock market started the week on a solid note, with the major averages trading higher throughout the session as tech leadership, broadening strength, and an intraday pullback in oil prices helped offset opening weakness tied to weekend geopolitical headlines. Today’s steady upward climb pushed the S&P 500 back into positive territory for the year, and saw the index reclaim all of its losses since the start of the war in Iran.
The S&P 500 (+1.0%), Nasdaq Composite (+1.2%), and DJIA (+0.6%) opened to broad losses on the heels of the U.S. and Iran failing to agree to a more durable ceasefire this weekend. Additionally, President Trump announced a blockade of all ships entering and leaving Iranian ports.
However, the early losses quickly began to fade, suggesting that the market remains confident that a potential end to the conflict could be imminent and that it will spur a sharp upward move across equities.
This afternoon, CNN reporter Alayna Treene posted on X that the Trump administration is discussing “a potential second, in-person meeting with Iranian officials before the ceasefire between Washington & Tehran expires next week,” reinforcing hopes for a near-term off-ramp.
The major averages were supported by a strong showing from the information technology sector (+1.3%), which was one of the first S&P 500 sectors to move into positive territory this morning. Software stocks garnered a strong buy-the-dip rebound from Friday’s selloff that came amid renewed fears of AI disruption. Oracle (ORCL 155.64, +17.54, +12.71%) was the top-performing S&P 500 component today, and the iShares GS Software ETF finished 5.4% higher.
Microsoft (MSFT 384.37, +13.50, +3.64%) was a mega-cap standout amid a solid session for the market’s heavyweights, which pushed the Vanguard Mega Cap Growth ETF 1.5% higher.
The financials sector (+1.7%) was the other notable outperformer in today’s session, supported by broad strength that saw only Goldman Sachs (GS 890.79, -17.01, -1.87%) finish in negative territory. The company topped earnings estimates, but succumbed to some “sell the news” pressure after an impressive run-up to its earnings report over the last month. However, the company’s record performance in Global Banking & Markets, combined with industry-leading M&A and equity underwriting activity, signals a meaningful rebound in capital markets and advisory demand, a positive read-through for peers as earnings season unfolds.
Elsewhere, the consumer discretionary (+0.9%) and communication services (+0.8%) sectors notched similar gains as mega-cap stocks charted fresh highs throughout the afternoon.
Only the defensive utilities (-1.2%) and consumer staples (-1.0%) sectors finished lower. Conagra (CAG 14.51, -0.67, -4.41%) was one of the worst-performing S&P 500 names after announcing that CEO Sean Connolly will step down on May 31, 2026, with John Brase set to take over as President and CEO effective June 1.
While the energy sector (+0.3%) managed a modest gain, it retreated sharply from its earlier highs in tandem with oil prices. WTI crude oil reached an overnight high of around $105 per barrel, but crude oil futures settled today’s session $2.42 higher (+2.5%) at $98.97 per barrel.
Outside of the S&P 500, the Russell 2000 (+1.5%) outperformed as the market leaned into a risk-on tone throughout the session, while the S&P Mid Cap 400 (+1.1%) captured a gain similar to that of the major averages.
Today’s action underscores the enthusiasm across the market that has pushed the major averages considerably higher over the past two weeks. Oil prices are stabilizing, and the mega-caps are reasserting their leadership, which has quickly negated losses incurred since the start of the Iran war. While volatility in oil prices will likely continue to cause price swings in the near term, the market’s resilience highlights a willingness to look past near-term macro developments as the Q1 earnings season ramps up.
U.S. Treasuries began the week with modest gains across the curve as the market maintained some overall optimism even though U.S.-Iran negotiations failed to produce a peace deal over the weekend. The 2-year note yield settled down two basis points to 3.78%, and the 10-year note yield settled down two basis points to 4.30%.
Reviewing today’s data:
- Existing home sales decreased 3.6% month-over-month in March to a seasonally adjusted annual rate of 3.98 million (Briefing.com consensus 4.01 million) from an upwardly revised 4.13 million (from 4.09 million) in February. Sales were down 1.0% on a year-over-year basis.
- The key takeaway from the report is that existing home sales were pressured at the start of the peak selling period by higher mortgage rates, higher prices, limited inventory, lower consumer confidence, and softer job growth.
Tuesday:
The stock market continued its strong start to the week as a sharp retreat in oil prices created a favorable backdrop for equities, while mega-cap stocks provided an additional boost by extending yesterday’s rally. The S&P 500 (+1.2%), Nasdaq Composite (+2.0%), and DJIA (+0.7%) posted gains that were nearly identical to yesterday’s advance, with the major averages now all in positive year-to-date territory.
Lingering optimism around a more permanent ceasefire continues to support the market’s sharp rebound over the past several weeks. President Trump told The New York Post that in-person negotiations between the U.S. and Iran could occur within the next two days.
So far, the temporary ceasefire and the U.S. blockade of Iranian ports are holding. Crude oil futures settled today’s session $7.66 lower (-7.7%) at $91.31 per barrel.
Today’s advance was supported by broad-based strength, with all but the energy (-2.2%), materials (-0.3%), and consumer staples (-0.2%) sectors finishing higher.
Growth-oriented areas led the way, with communication services (+3.2%) and consumer discretionary (+2.5%) sectors posting outsized gains behind continued mega-cap leadership. Meta Platforms (META 662.46, +27.92, +4.40%) was a “magnificent seven” standout, while Amazon (AMZN 248.97, +9.08, +3.79%) traded higher after reports that the company is set to acquire Globalstar (GSAT 79.91, +7.02, +9.63%).
NVIDIA (NVDA 196.46, +7.15, +3.78%) captured a similar gain, and the information technology sector (+1.7%) also finished near the top of today’s leaderboard. Micron (MU 465.66, +39.10, +9.17%) was one of the best-performing S&P 500 names today, and the PHLX Semiconductor Index (+2.0%) steadily charted session highs throughout the session.
All told, the Vanguard Mega Cap Growth ETF finished 2.0% higher, helping the market-weighted S&P 500 (+1.2%) outperform the S&P 500 Equal Weighted Index (+0.4%).
Elsewhere, investors had plenty of earnings and corporate news items of note today. The financials sector (+0.2%) captured a modest gain as the market had mixed reactions to the earnings reports of several major banking names. Citigroup (C 129.65, +3.37, +2.67%) was a standout after topping earnings expectations and issuing upside Net Interest Income guidance, while JPMorgan Chase (JPM 311.12, -2.56, -0.82%) also beat expectations but issued a modest downward revision to its FY2026 net interest income.
Meanwhile, Wells Fargo (WFC 81.73, -4.91, -5.67%) was one of the worst-performing S&P 500 components after narrowly topping EPS estimates but missing on revenues.
Airlines also had an eventful session after Bloomberg reported that United Airlines (UAL 97.17, +1.97, +2.07%) floated the possibility of a merger with American Airlines (AAL 12.13, +0.90, +8.01%).
Outside of the S&P 500, the Russell 2000 (+1.4%) captured another solid gain as the market leans into a risk-on tone, while the S&P Mid Cap 400 (+0.5%) finished with a more modest gain.
After two solid days of broad strength, the major averages are back into positive territory for the year as the market shakes off losses tied to the war in Iran. This morning’s release of the March PPI report added further support to the rebound narrative, with both the headline (0.5%; Briefing.com consensus 1.2%) and core (0.1%; Briefing.com consensus 0.4%) readings coming in cooler-than-expected.
While there has yet to be a conclusive end to the conflict, the market remains confident that disruptions across global oil markets will pressure Iran into a more durable ceasefire agreement sooner rather than later.
Overall, the tone remains constructive as falling oil prices, easing inflation pressures, and renewed mega-cap leadership continue to support the market’s advance. With Q1 earnings season beginning to ramp up, strength in mega-cap names is once again playing an outsized role in driving index performance, leaving the S&P 500 just 0.5% below its all-time high.
U.S. Treasuries had a solid outing on Tuesday, making for a continuation of an upbeat start to the week amid a growing sense that the Iran conflict will conclude soon. The 2-year note yield settled down three basis points to 3.75%, and the 10-year note yield settled down four basis points to 4.26%.
Reviewing today’s data:
- March NFIB Small Business Optimism 95.8 (Briefing.com consensus 98.0 mln); Prior 98.8
- March PPI 0.5% (Briefing.com consensus 1.2%); Prior was revised to 0.5% from 0.7%, March Core PPI 0.1% (Briefing.com consensus 0.4%); Prior was revised to 0.3% from 0.5%
- The key takeaway from the report is that the inflation seen at the wholesale level in March was driven largely by energy prices and gasoline prices (+15.7%) in particular. The index for final demand services was unchanged, so the market is giving itself some latitude to look through the energy price shock as something that is temporary.
Wednesday:
The stock market saw another day of strong gains in mega-cap and tech stocks, pushing the S&P 500 (+0.8%) to new intraday (7,026.24) and closing (7,022.95) highs. The tech-heavy Nasdaq Composite (+1.6%) notched an even wider gain, and captured a record closing high of its own.
Meanwhile, weakness in the broader market saw the DJIA (-0.2%) face a modest retreat as gains were largely confined to growth-oriented pockets of the market.
Equities remain supported by an improving geopolitical backdrop, as reports circulated that the U.S. and Iran may soon meet for another round of negotiations aimed at extending the current ceasefire. Importantly, oil prices remain stable, with crude oil futures settling today’s session $0.01 lower (-0.01%) at $91.30 per barrel.
Gains were led by the top-weighted information technology sector (+2.1%), which extended its week-to-date gain to 5.6%. Software names led the advance, with Microsoft (MSFT 411.22, +18.11, +4.61%) a notable “magnificent seven” standout and packaged software names such as Datadog (DDOG 121.06, +10.49, +9.49%) and ServiceNow (NOW 94.19, +6.40, +7.29%) posting even wider gains. The iShares GS Software ETF finished 4.4% higher.
Semiconductor names were relative underperformers, though the PHLX Semiconductor Index (+0.2%) eked out a slight gain. Sandisk (SNDK 891.72, -52.74, -5.58%) deepened yesterday’s reversal from a record high, while AI-infrastructure stocks such as KLA Corporation (KLAC 1748.11, -47.80, -2.66%) lagged after ASML (ASML 1481.77, -36.53, -2.41%) topped earnings estimates but lowered its Q2 guidance. Broadcom (AVGO 396.72, +15.94, +4.19%) still captured a nice gain after announcing an expanded partnership with Meta Platforms (META 673.10, +10.60, +1.60%) to support the company’s rapidly scaling artificial intelligence compute infrastructure.
Meta’s gain contributed to strength in the communication services sector (+1.1%), while the consumer discretionary sector (+1.4%) captured a similar gain as Tesla (TSLA 391.95, +27.75, +7.62%) moved sharply higher.
All told, the Vanguard Mega Cap Growth ETF advanced 1.9%, which contributed to the outperformance of the market-weighted S&P 500 (+0.8%) relative to the S&P 500 Equal Weighted Index (flat).
The financials sector (+0.8%) was the only other S&P 500 sector to notch a gain today, supported by a solid gain from Morgan Stanley (MS 191.60, +8.26, +4.51%) after topping earnings estimates and Robinhood Markets (HOOD 87.32, +8.23, +10.41%) finishing as one of the top-performing S&P 500 components after the SEC approved a proposal from FINRA to eliminate the current day trading margin requirements.
As for the broader market, losses were relatively modest in nature, though there were some notable underperformers.
The industrials sector (-1.2%) underperformed, with names such as Caterpillar (CAT 770.17, -24.08, -3.03%) and Carrier Global (CARR 58.55, -6.11, -9.45%) lagging. Recent Fed commentary suggests rates will remain unchanged for some time in response to oil-driven inflation, and the sector is particularly sensitive to higher rates given its capital-intensive nature and the reliance of its customers on financing for large equipment and infrastructure projects.
Elsewhere, the materials (-1.3%) sector saw a continuation of recent weakness, while the defensive utilities (-0.9%), health care (-0.7%), and consumer staples (-0.4%) underperformed amid the strength in growth stocks.
Outside of the S&P 500, the Russell 2000 (+0.3%) managed to capture a modest gain, while the S&P Mid Cap 400 (-0.3%) lagged.
Today’s session marked an important milestone for the market as it looks to leave the Iran war in the rearview, with the S&P 500 eclipsing its previous record high from late January. Mega-cap and tech stocks are back in the driver’s seat, which is important for index-level growth, especially since the group was off to a relatively subdued start to the year before the conflict in Iran prompted sharp losses. While the full impact of the surge in oil prices on inflation (and, in turn, rate cut expectations) remains to be seen, the market is back on firmer ground as Q1 earnings begin to ramp up.
U.S. Treasuries dipped on Wednesday, giving back the bulk of their Tuesday gains in an otherwise quiet midweek session. The 2-year note yield settled up two basis points to 3.77%, and the 10-year note yield settled up three basis points to 4.28%.
Reviewing today’s data:
- Weekly MBA Mortgage Applications Index 1.8%; Prior -0.8%
- April Empire State Manufacturing 11.0 (Briefing.com consensus 0.0); Prior -0.2 March Import Prices 0.8%; Prior was revised to 0.9% from 1.3%
- March Import Prices ex-oil 0.6%; Prior was revised to 0.8% from 1.1%
- March Export Prices 1.6%; Prior was revised to 1.9% from 1.5% March Export Prices ex-ag. 1.7%; Prior was revised to 2.1% from 1.7%
- April NAHB Housing Market Index 34 (Briefing.com consensus 38); Prior 38
Thursday:
The stock market had another constructive session that saw the S&P 500 (+0.3%) and Nasdaq Composite (+0.4%) notch fresh record highs for the second consecutive day, while broader participation helped the DJIA (+0.2%) capture a similar gain.
The initial intraday record highs were set shortly after the open, but the major averages spent much of the morning in negative territory as mega-cap and tech stocks, which were responsible for yesterday’s advance, meandered lower.
The Vanguard Mega Cap Growth ETF (+0.3%) finished with a modest gain, but the top-weighted information technology sector (+0.8%) charted a firmly higher course and pushed the major averages back into positive territory just before midday.
Software stocks extended this week’s advance, with the iShares GS Software ETF finishing 1.7% higher. Microsoft (MSFT 420.26, +9.04, +2.20%) was the only “magnificent seven” name to finish with a gain of 1.0% or wider.
While the PHLX Semiconductor Index (+1.0%) captured a more modest gain, its reversal into positive territory played a key role in moving the major averages off their session lows. Advanced Micro Devices (AMD 278.26, +20.14, +7.80%) delivered another strong performance, extending its month-to-date gain past 34% as the stock continues to rebound from recent lows against a backdrop of positive analyst chatter.
Although it is not a component of the S&P 500, Taiwan Semiconductor Manufacturing (TSM 363.34, -11.76, -3.14%) traded lower after topping earnings estimates but guiding Q2 revenues below consensus. However, the company’s CEO noted on its earnings call that the company continues to see robust AI-related demand.
Outside of the technology sector, participation was broader than yesterday’s action, with seven S&P 500 sectors finishing higher. The energy sector (+1.6%) captured the widest gain as crude oil futures settled today’s session $3.41 higher (+3.7%) at $94.71 per barrel. The higher price of oil weighed on some oil-sensitive pockets of the market, such as airlines and cruise lines, which contributed to weakness in the industrials (-0.5%) and consumer discretionary (-0.2%) sectors.
However, the current geopolitical backdrop remains generally constructive, with President Trump announcing a 10-day ceasefire between Israel and Lebanon and noting that talks with Iran will “probably” resume over the weekend.
Elsewhere, the defensive utilities (+0.7%) and consumer staples (+0.3%) sectors finished higher after facing pressure in previous sessions as growth-oriented stocks outperformed. Investors reacted positively to PepsiCo’s (PEP 158.35, +3.50, +2.26%) earnings report, which saw the company top estimates and reaffirm its FY26 guidance.
Those rotational gains across defensive sectors were not extended to the health care sector (-0.8%). The sector faced weakness across medical specialty names after Abbott Labs (ABT 95.46, -6.10, -6.01%) beat earnings and revenue expectations but issued below-consensus guidance for Q2 and FY26.
Charles Schwab (SCHW 92.59, -7.68, -7.66%) was the only stock to finish with a wider loss after announcing Schwab Crypto, a spot crypto trading platform with a flat 75 basis point fee that is viewed as a disruptive, lower-cost alternative to existing crypto-native platforms.
Overall, today’s session underscored the recent improvement in sentiment across equities, leaving the market comfortable enough to extend into record territory. While the gains were modest in comparison to recent sessions, investors were quick to buy this morning’s dip in mega-cap and tech names, which helped the Nasdaq Composite notch its 12th consecutive higher finish.
Looking ahead, attention will center on whether this improved tone can translate into a more durable broadening of participation, particularly beyond mega-cap and technology leadership. Investors will also be focused on whether the market can maintain its current earnings growth projections as Q1 earnings season progresses.
U.S. Treasuries faced some more pressure on Thursday, lifting the 30-yr yield toward this week’s high (4.944%) while yields on shorter tenors returned to their opening levels from Tuesday. The 2-year note yield settled up one basis point to 3.78%, and the 10-year note yield settled up three basis points to 4.31%.
- Russell 2000: +9.6% YTD
- S&P Mid Cap 400: +8.2% YTD
- Nasdaq Composite: +3.7%
- S&P 500: +2.9%
- DJIA: +1.1%
Reviewing today’s data:
- April Philadelphia Fed Index 26.7 (Briefing.com consensus 12.7); Prior 18.1
- Weekly Initial Claims 207K (Briefing.com consensus 215K); Prior was revised to 218K from 219K, Weekly Continuing Claims 1.818 mln; Prior was revised to 1.787 mln from 1.794 mln
- The key takeaway from the report is that it refutes any notion that the labor market is cracking in a way that will lock up discretionary spending. Initial jobless claims—a leading indicator—continue to run at historically low levels.
- March Industrial Production -0.5% (Briefing.com consensus 0.1%); Prior was revised to 0.7% from 0.2%, March Capacity Utilization 75.7% (Briefing.com consensus 76.4%); Prior was revised to 76.1% from 76.3%
- The key takeaway from the report is that the headline decline is not as bad as it looks when taking into account the large upward revision to industrial production in February, which effectively offsets the decline in March.
Friday:
The stock market capped an impressive week with a strong rally as retreating oil prices, improved rate-cut odds, and broadening participation pushed stocks further into record territory. The S&P 500 (+1.2%) and Nasdaq Composite (+1.5%) notched record intraday and closing highs for the third consecutive session, with the Nasdaq Composite locking in a 13th consecutive higher finish, a feat not accomplished since 1992.
Solid participation across the broader market helped the DJIA (+1.8%) slightly outperform, while expectations for a potentially more favorable interest rate environment saw the Russell 2000 (+2.1%) and S&P Mid Cap 400 (+2.0%) capture even wider gains.
Stocks soared higher at the open following an announcement from Iran’s foreign minister that the Strait of Hormuz will reopen to commercial traffic for the remainder of the U.S.-Iran ceasefire, which is set to expire on Tuesday. Additionally, The Wall Street Journal reported that the next round of talks between the two nations is likely to take place on Monday in Pakistan, and President Trump announced that Iran has indefinitely suspended its nuclear program.
Crude oil futures settled today’s session $10.49 lower (-11.1%) at $84.22 per barrel, paving the way for broad participation and some impressive gains.
Airlines and cruise lines such as United Airlines (UAL 101.78, +6.75, +7.10%) and Royal Caribbean (RCL 285.48, +19.53, +7.34%) outperformed as oil retreated, contributing to strength in the consumer discretionary (+2.0%) and industrials (+1.8%) sectors.
Both sectors were also supported by solid gains across rate-sensitive stocks such as homebuilders and building supply names. The iShares U.S. Home Construction ETF finished 4.6% higher.
The pullback in oil prices has tempered the market’s inflation expectations, and the CME FedWatch tool is now assigning a 50% probability to a rate cut of at least 25 basis points at the December FOMC meeting, up from around 30% yesterday.
Elsewhere, the top weighted information technology sector (+1.6%) also kept pace with the gains with semiconductor stocks leading the sector’s advance, pushing the PHLX Semiconductor Index 2.4% higher.
Apple (AAPL 270.23, +6.83, +2.59%) was one of the best-performing “magnificent seven” stocks after Reuters reported China iPhone shipments increased 20% in the first quarter.
The communication services sector (+0.8%) logged one of the narrower gains today as Netflix (NFLX 97.31, -10.48, -9.72%) moved sharply lower after issuing disappointing Q2 guidance in its earnings release yesterday. Still, the sector finished well off its session lows due to strong leadership from its mega-cap components Alphabet (GOOG 339.40, +6.63, +1.99%) and Meta Platforms (META 688.55, +11.68, +1.73%). The Vanguard Mega Cap Growth ETF finished 1.4% higher.
Only the energy (-2.9%) and utilities (-0.4%) sectors finished lower.
Momentum remains firmly to the upside, with buyers continuing to push stocks into record territory with relative ease. The major averages have now notched week-to-date gains of at least 3% for three consecutive weeks, underscoring the strength of the rally as easing geopolitical tensions and improving rate-cut expectations continue to reinforce the market’s bullish backdrop.
U.S. Treasuries had a strong finish to the week, pressuring yields on most tenors to their lowest closing levels in a month. The 2-year note yield settled down eight basis points to 3.70% (-10 basis points this week), and the 10-year note yield settled down six basis points to 4.25% (-7 basis points this week).
There was no economic data of note today.
- Russell 2000: +11.9% YTD
- S&P Mid Cap 400: +10.3% YTD
- Nasdaq Composite: +5.3% YTD
- S&P 500: +4.1% YTD
- DJIA: +2.9% YTD
BONDS AND YIELDS
U.S. Treasuries had a strong finish to the week, pressuring yields on most tenors to their lowest closing levels in a month. The trading day started with slim gains after a quiet night in global markets. Asian equities faced some profit taking after a strong week, even though the market grew more confident that the Iran conflict is nearing a conclusion. That sentiment strengthened during the day after Iran’s foreign minister said that the Strait of Hormuz is open after the ceasefire agreement between Israel and Lebanon. That announcement sent the price of oil to a five-week low while Treasuries built on their slim opening gains, pressuring yields on the 10-yr note and shorter tenors to one-month lows. Later in the day, President Trump said that he expects a deal to come together in the next couple days and that Iran agreed to suspend its nuclear program indefinitely. Today’s rally put the potential for a December rate cut back on the table, with the implied likelihood of a reduction at that time now essentially a toss-up, up from just 30% yesterday. Crude oil extended this week’s loss to $12/bbl, finishing below $85/bbl, while the U.S. Dollar Index fell 0.2% to 98.01, giving up 0.7% for the week.
YIELD CHECK
- 2-yr: -8 bps to 3.70% (-10 bps this week)
- 3-yr: -8 bps to 3.72% (-10 bps this week)
- 5-yr: -8 bps to 3.84% (-10 bps this week)
- 10-yr: -6 bps to 4.25% (-7 bps this week)
- 30-yr: -4 bps to 4.89% (-2 bps this week)
BOND YIELDS
Treasury Yields Fall on Hormuz Reopening News
The yield on the US 10-year Treasury note fell by nearly 7 basis points to around 4.25% on Friday, approaching one-month lows, as news of the temporary reopening of the Strait of Hormuz helped ease inflation concerns, at least in the short term. Iran’s Foreign Minister, Abbas Araghchi, confirmed that the strait is now fully open to all commercial vessels for the duration of the 10-day ceasefire. In response, oil prices tumbled more than 10%, prompting traders to increase bets on Federal Reserve rate cuts this year. Markets are now pricing in roughly a 50-50 chance of a 25-basis-point rate cut by year-end, up from about a 30% probability on Thursday. This compares with earlier expectations of two rate cuts before the conflict escalated.

- 3M: +1 bps at 3.70%
- 2Y: -10 bps at 3.71%
- 5Y: -10 bps at 3.84%
- 10Y: -5 bps at 4.26%
- 30Y: -5 bps at 4.88%
Only the 3M bond yield rose for the week. The 2Y/5Y/10Y/30Y all declined for the week, especially the shorter tenors.
EARNINGS
S&P 500 Earnings Season Update: April 17, 2026
At this early stage, the first quarter earnings season for the S&P 500 is off to a strong start relative to expectations. Both the percentage of S&P 500 companies reporting positive earnings surprises and the magnitude of earnings surprises are above recent averages. As a result, the index is reporting higher earnings for the first quarter today relative to the end of last week but still reporting flat earnings relative to the end of the quarter. However, the index is also reporting double-digit (year-over-year) earnings growth for the 6th straight quarter.
Overall, 10% of the companies in the S&P 500 have reported actual results for Q1 2026 to date. Of these companies, 88% have reported actual EPS above estimates, which is above the 5-year average of 78% and above the 10-year average of 76%. In aggregate, companies are reporting earnings that are 10.8% above estimates, which is above the 5-year average of 7.3% and above the 10-year average of 7.1%. Historical averages reflect actual results from all 500 companies, not the actual results from the percentage of companies that have reported through this point in time.
During the past week, positive EPS surprises reported by companies in the Financials and Communication Services sectors, partially offset by downward revisions to EPS estimates for companies in the Energy sector, were the largest contributors to the increase in the overall earnings growth rate for the index over this period.Since March 31, positive EPS surprises reported by companies in the Financials and Communication Services sectors have been offset by downward revisions to EPS estimates for companies in the Energy and Health Care sectors, resulting in no change in the overall earnings growth rate for the index over this period.
As a result, the index is reporting higher earnings for the first quarter today relative to the end of last week but still reporting flat earnings relative to the end of the quarter. The blended (combines actual results for companies that have reported and estimated results for companies that have yet to report) earnings growth rate for the first quarter is 13.2% today, compared to an earnings growth rate of 12.2% last week and an earnings growth rate of 13.2% at the end of the first quarter (March 31).
If 13.2% is the actual growth rate for the quarter, it will mark the 6th consecutive quarter of double-digit (year-over-year) earnings growth for the index.
Eight of the eleven sectors are reporting (or are projected to report) year-over-year earnings growth, led by the Information Technology, Materials, Financials, and Utilities sectors. On the other hand, three sectors are reporting (or are predicted to report) a year-over-year decline in earnings, led by the Energy and Health Care sectors.
In terms of revenues, 84% of S&P 500 companies have reported actual revenues above estimates, which is above the 5-year average of 70% and above the 10-year average of 67%. In aggregate, companies are reporting revenues that are 2.0% above the estimates, which is equal to the 5-year average of 2.0% but above the 10-year average of 1.5%. Again, historical averages reflect actual results from all 500 companies, not the actual results from the percentage of companies that have reported through this point in time.
As a result, the blended revenue growth rate for the first quarter is 9.9% today, compared to a revenue growth rate of 9.8% last week and a revenue growth rate of 9.8% at the end of the first quarter (March 31).
During the past week, positive revenue surprises reported by companies in the Financials sector were the largest contributors to the small increase in the overall revenue growth rate for the index over this period. Since March 31, positive revenue surprises reported by companies in the Financials sector have been the largest contributors to the small increase in the overall revenue growth rate for the index over this period.
If 9.9% is the actual revenue growth rate for the quarter, it will mark the highest revenue growth rate reported by the index since Q3 2022 (11.0%).
All eleven sectors are reporting (or are projected to report) year-over-year growth in revenues, led by the Information Technology, Communication Services, and Financials sectors.
For Q2 2026 through Q4 2026, analysts are calling for earnings growth rates of 20.1%, 22.2%, and 19.9%, respectively. For CY 2026, analysts are predicting (year-over-year) earnings growth of 18.0%.
The forward 12-month P/E ratio is 20.9 (based on Wednesday’s closing price and forward EPS), which is above the 5-year average (19.9) and above the 10-year average (18.9). This P/E ratio is also above the forward P/E ratio of 19.7 recorded at the end of the first quarter (March 31).
During the upcoming week, 93 S&P 500 companies (including 7 Dow 30 components) are scheduled to report results for the first quarter.
Q1 2026: Scorecard
Insight/2026/04.2026/04.17.2026_Earnings%20Insight/01-sp500-earnings-above-inline-below-estimates-q1-2026.png?width=672&height=384&name=01-sp500-earnings-above-inline-below-estimates-q1-2026.png)
Insight/2026/04.2026/04.17.2026_Earnings%20Insight/02-sp500-revenues-above-inline-below-estimates-q1-2026.png?width=672&height=384&name=02-sp500-revenues-above-inline-below-estimates-q1-2026.png)
Q1 2026: Growth
Insight/2026/04.2026/04.17.2026_Earnings%20Insight/03-sp500-earnings-growth-q1-2026.png?width=672&height=384&name=03-sp500-earnings-growth-q1-2026.png)
Insight/2026/04.2026/04.17.2026_Earnings%20Insight/04-sp500-revenue-growth-q1-2026.png?width=672&height=384&name=04-sp500-revenue-growth-q1-2026.png)
By John Buters | 2026 APRIL 17 | Factset.com
WEEK 17 EARNINGS CALENDAR
- Monday (April 20)
- Pre-Market: BOH CLF
- After-Hours: ALK BOKF STLD WTFC ZION
- Pre-Market: MMM AUB DHI DHR EFX FOR GE GPC HAL MSCI NTRS NOC OFG DGX RTX SYF TSCO UCB UNH VMI VICR
- After-Hours: ADC OZK CALX COF CB CYH EWBC EQT ELS HWC IBKR ISRG MANH MCRI NBHC PEGA RRC SON UAL WRB WFRD WSBC WAL ZWS
- Wednesday (April 22)
- Pre-Market: T BKU BA BSX CME ELV FBP GEV MHO MAS MCO EDU NVR ONB OTIS PM TMHC TEL TDY TNL VRT WAB
- After-Hours: ASGN AZZ BANC CACI CATY CCS CHDN CCI CSX EGP EPRT FAF FRME FR FULT GTY GL GSHD GGG HLX HXL IBM KALU KMI KNX LRCX LVS LBRT MEDP MTH MOH NP OII PKG CASH PTEN PNFP QS RJF RS RLI ROL SEIC SIGI NOW LUV STC TSLA TXN URI WEX
- Thursday (April 23)
- Pre-Market: AAL AXP AMBP BX BFH CBRE CNP DOV DOW FCX THRM HELE HON HBAN IRDM KDP LADR LMT MBLY NDAQ NEE NOK ORI PENN PCG POOL BPOP PHM ROP R SNY SAP SNA STM STRA TCBI TMO UNP VLY VC WST
- After-Hours: AMP ABCB APPF ASB BKR BYD CSL CHE COLB CUBI DLR EW ENVA FFBC GLPI GBCI HIG INTC KNSL KN MXL NEM PECO PFG REXR SLM SKYW SSB SSNC VRSN WKC WSFS
- Friday (April 24)
- Pre-Market: APOG CHTR FHB FLG GNTX HCA NSC PG SXT SLB WU
After-Hours: HTH
- Pre-Market: APOG CHTR FHB FLG GNTX HCA NSC PG SXT SLB WU
SEASONALS
WEEK 16: MONDAY TO FRIDAY, APRIL 20 to APRIL 24
According to the PTSD*, Week 17 has FIVE trading days and is the LAST trading week in April 2026. The next Expiration Friday is MAY15. The next Market Holiday is on MONDAY MAY25. Seasonally, Weeks 16 and 17 have historically been the most bullish weeks of the year. April is the last of the “6 months of bullishness” on the SPX.
We also need to keep in mind that with the current POTUS, seasonals can easily go out of whack.
*PTSD – Penguin Trader Seasonal Data.
BENCHMARK INDICES (21-YEAR AVERAGE)
The Stock Trader’s Almanac’s stats for the Benchmark Indices Week 17 over a 21-year average.

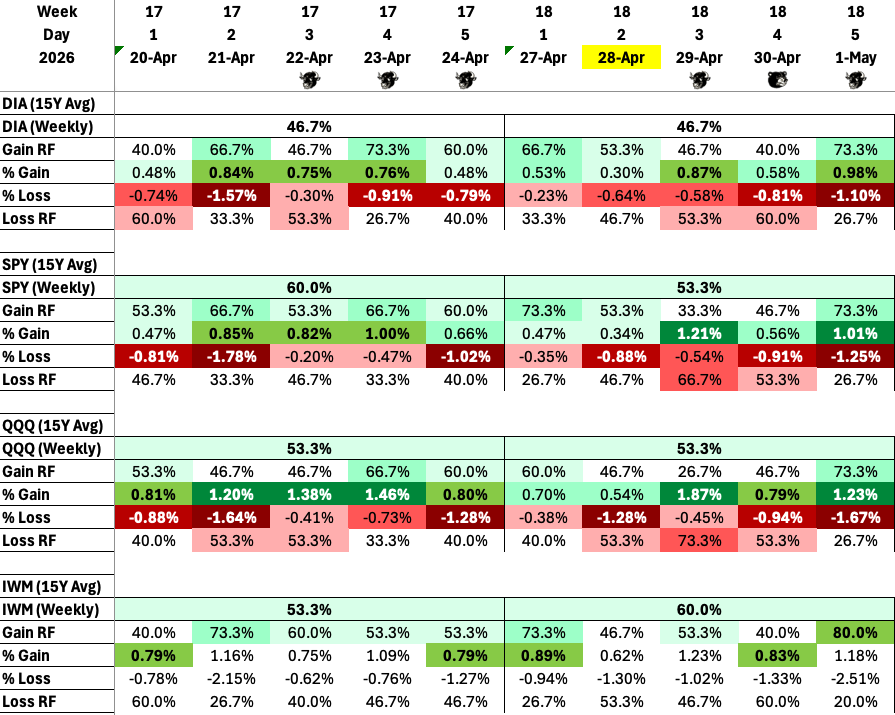
BENCHMARK INDEX ETFs
The Penguin Trader Seasonal Data (PTSD) stats for the Benchmark Index ETFs Week 17 – 15 year AVERAGE.
ANALYSIS
PUT/CALL RATIOS
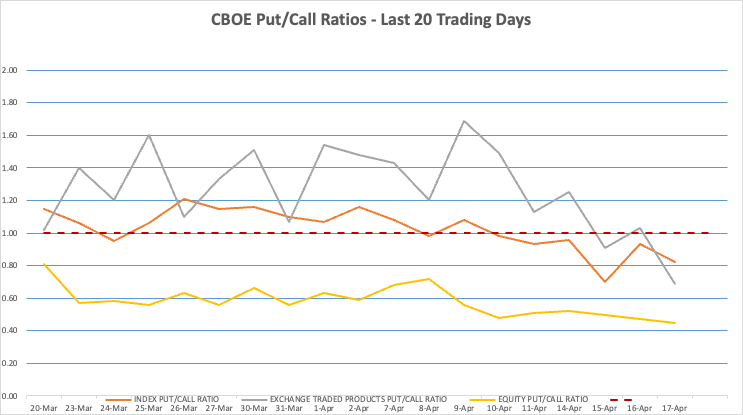
Any reading above 1.00 is regarded as bearish.
As a common practice among professionals, it is worth noting that the big-money indicators are the Index and ETF Put/Call Ratios, while Equity Put/Call Ratios are mostly for novice/amateur participation.
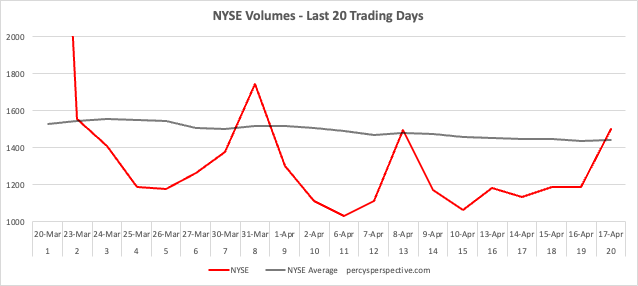
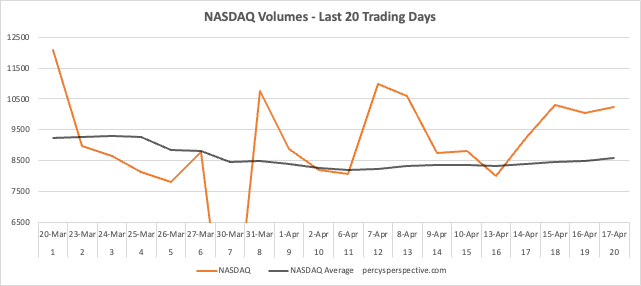
VOLUMES
SHILLER PE RATIO
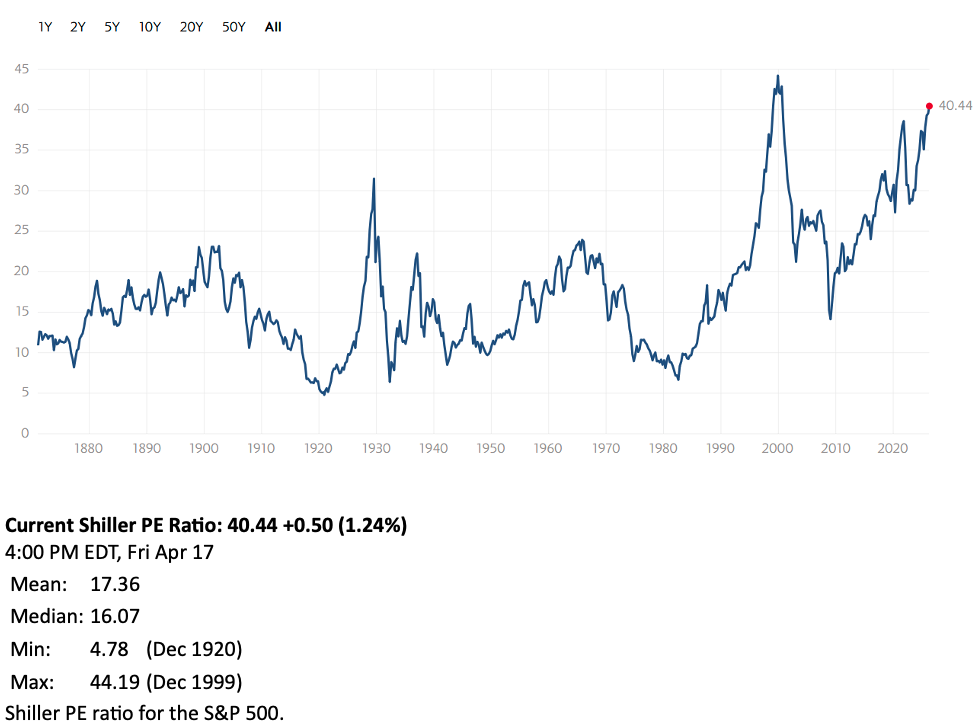
The Shiller PE Ratio, as of Fri 17 Apr, is at 40.44, 2.77% higher than the previous week of 39.35.
This is more than double of its mean (17.35) and its median (16.07). At this level, the ratio is above the middle between the historical high (44.19) and the mean or the median. The U.S. market printed its third highest Shiller PE Ratio in its history at 40.94 on 9 Jan 2026. The largest bubble remains as December 1999 at 44.19.
DAILY MONITORING TABLE (Last 5 Weeks)
This is the 3rd straight week with nil bearish convergent sessions and 4 bullish convergent sessions.
Over the last 5 weeks (24 trading sessions), there were 5 bearish divergent sessions, 13 bullish convergent sessions, and 6 divergent sessions (between the daily percentage changes and the market internals).
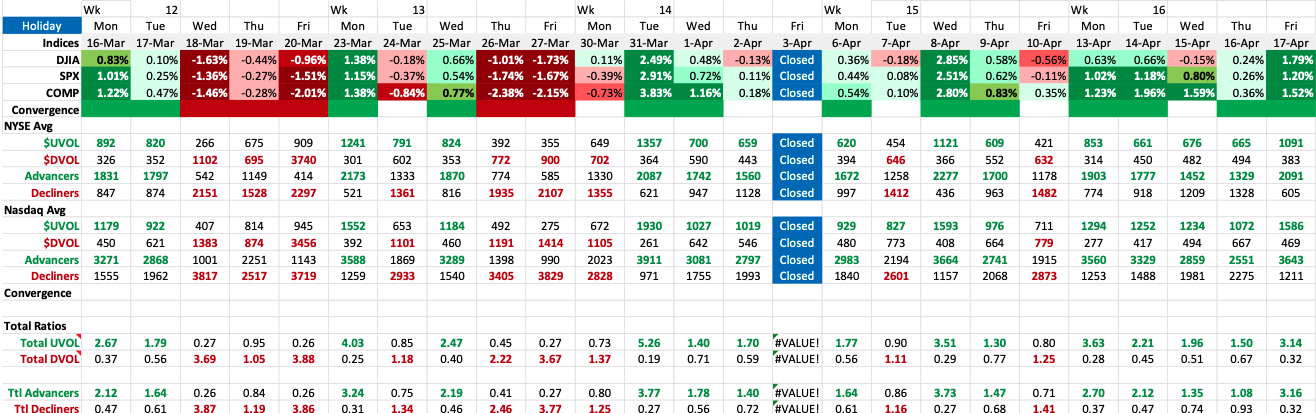
UVOL/DVOL and ADVANCES vs DECLINERS for NYSE and NASDAQ
Week 16 lives up to its reputation as being the most bullish week of the year as the Bulls overran the Bears this week in terms of UVOL and Advancers.

THE WEEK AHEAD
US Economic Releases
- Mon 20 Apr
- Nothing of note
- Tue 21 Apr
- Core Retail Sales m/m
- Retail Sales m/m
- Fed Chair-Designate Warsh Testifies
- Pending Home Sales m/m
- Wed 22 Apr
- Nothing of note
- Thu 23 Apr
- Unemployment Claims
- Flash Manufacturing PMI
- Flash Services PMI
- Fri 24 Apr
- Revised UoM Consumer Sentiment
International Releases
- Mon 20 Apr
- EU: ECB President Lagarde Speaks
- Tue 21 Apr
- UK: Claimant Count Change, Average Earnings Index 3m/y
- Wed 22 Apr
- UK: CPI y/y
- EU: ECB President Lagarde Speaks
- Thu 23 Apr
- EU: French Flash Manufacturing PMI, French Flash Services PMI, German Flash Manufacturing PMI, German Flash Services PMI
- UK: Flash Manufacturing PMI, Flash Services PMI
- Fri 24 Apr
- UK: Retail Sales m/m
Week Ahead
The potential for an agreement between Iran and the US to end their war will continue to dominate market movements and the outlook of the global economy, with promising signals from both sides recently hinting at a resolution. Corporate earnings results also remain in the spotlight with results due from Tesla, Intel, UnitedHealth, Amex, and P&G. For economic data, retail sales will be closely eyed, and the S&P PMI will be featured. Regarding US monetary policy, Fed Chair Nominee Warsh will testify before Congress in his first public speaking regarding the cargo. In Europe, PMIs and local sentiment indices will give more insights on how the economy adapts to surges in energy prices. A busy week in the UK will include the inflation rate and retail sales. In Asia, the PBoC will set its loan prime rates and Japan will unveil trade figures, inflation and join India and Australia in release PMI.
Americas
The outlook of the US economy will continue to depend on developments regarding the war with Iran and how it impacts global energy prices. President Trump signaled that Iran agreed to suspend its nuclear program and stop targeting commercial vessels crossing the Strait of Hormuz, supporting expectations of an incoming agreement. The schedule for corporate results will also remain compact, with Tesla, Intel, GE Aerospace, UnitedHealth, American Express, P&G, and Lam Research reporting. On the economic data front, the US will release retail sales for March, expected to rise the most in one year at 1.3% and extend the period of consumer strength. Meanwhile, flash S&P PMIs for April are also due after having reflected contrasting impacts of the Iran war on the manufacturing and services sectors of the economy. Other releases include pending home sales, which are expected to have risen 0.5%, and business inventories for February, set to have inched higher. On the monetary policy front, Federal Reserve Chairman nominee Kevin Warsh will testify before Congress, likely elaborating on his views on the Federal Reserve’s appropriate balance sheet size. Elsewhere in the Americas, a busy week of economic data releases in Canada will be headlined by March’s inflation rate, due to unveil the initial impact of the war. Canada will also release new housing prices, retail sales, and budget balance. Also, Mexico will release mid-month inflation updates.
Europe
Flash PMIs for the Euro Area, Germany, France, and the UK will be the main focus in the coming week. Across the board, expectations point to softer readings, with indices likely declining to reflect slower expansion or deeper contraction in both manufacturing and services. In Germany, the ZEW Economic Sentiment Index is projected to fall to a one-year low, while the Ifo Business Climate Index is expected to decline further, reaching its weakest level since February 2025. Beyond PMIs in the UK, a heavy slate of key data will be released, including inflation, labour market figures, and retail sales. Annual inflation is forecast to rise to 3.3%. The unemployment rate is expected to remain unchanged at 5.2%, holding at its highest level since early 2021. Total average weekly earnings, including bonuses, are projected to increase by 3.6%, the slowest pace since October 2020. Meanwhile, retail sales are expected to rebound in March, marking a third increase in four months. Other notable releases include the Euro Area’s government deficit and debt, flash consumer sentiment, and new car registrations. Germany will publish its producer price index, while the UK will release CBI surveys on industrial trends orders and business optimism. Switzerland will report its trade balance, and central bank rate decisions are due from Turkey and Russia. On the corporate side, earnings highlights include L’Oréal, EssilorLuxottica, and ABB on Wednesday. Thursday brings results from SAP, Safran, and Sanofi. In the UK, Associated British Foods reports on Tuesday. Spanish banks Banco Sabadell and Bankinter are due on Thursday. From Italy, Moncler and Saipem report Tuesday, followed by Eni on Friday.
Asia Pacific
In China, there are no major economic releases scheduled next week, but the People’s Bank of China is expected to keep its one- and five-year loan prime rates unchanged at 3% and 3.5%, respectively. Stronger-than-expected first-quarter GDP growth and an unexpected rise in producer prices gave policymakers additional room before considering further easing. In Japan, attention will turn to March trade data, with exports seen rising at a faster 11.1%, widening the trade surplus to JPY 1100 billion. Also, inflation data will likely show an acceleration in the core rate to 1.8% while flash PMI readings for April are due. The manufacturing one is expected to show a small uptick in factory growth. Flash PMI reports are also due from India and Australia. Elsewhere in the region, trade data is set for release from New Zealand, Malaysia, Thailand and Saudi Arabia while inflation figures will be reported in New Zealand, Singapore and Hong Kong. Labor market data is expected from Hong Kong and Taiwan, while South Korea will publish its latest GDP figures. On the monetary policy front, Bank Indonesia and Bangko Sentral ng Pilipinas will decide on monetary policy.
By andre.joaquim@tradingeconomics.com | 2026 APRIL 17
ANALYSIS
A penguin will be volunteered for this post soon, or if incentivised with enough cheese.
COMMENTARY
Please stay hedged, my fellow penguins.
The very positive Week 16 has expectations of an even more bullish Week 17 (as evidenced in the PUT/CALL Ratios) put into question. POTUS has just posted some very warlike calls on his Social Media Network, Iran has closed the Straits of Hormuz, cos the USN is also performing a blockade.
Nothing makes sense now, however logical. I am just selling time on my spreads. The CALL wing on my SPX IC was ITM for a short while on Friday night. Given the current news, I believe there is a possibility the SPX could drop into an AMO.
The DFDM I was expecting… did not happen. Oh well.
Stay Hedged, my Penguin Friends.
(Excerpts from briefing.com, tradingeconomics.com, financialscents.com, factset.com, marketwatch.com, etrade.com, yahoo.com, tigerbrokers.com, tradingview.com, tradingcentral.com, theedgemalaysia.com, sectorspdrs.com, Investopedia.com, and CNBC.com)