DMA of 2026 APRIL 16 THURSDAY AMC.
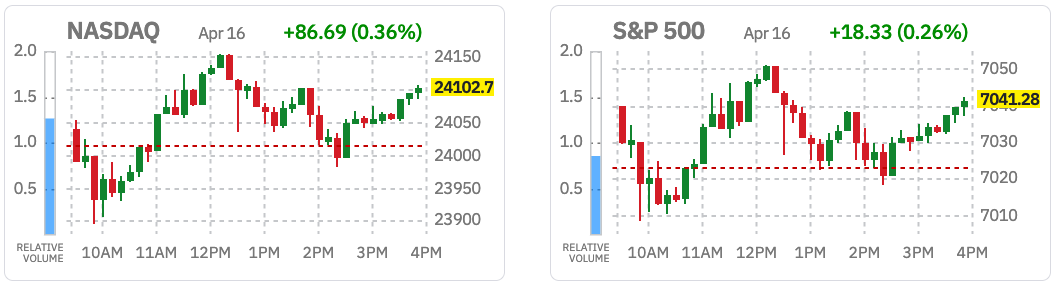
The stock market had another constructive session that saw the S&P 500 (+0.3%) and Nasdaq Composite (+0.4%) notch fresh record highs for the second consecutive day, while broader participation helped the DJIA (+0.2%) capture a similar gain.
The initial intraday record highs were set shortly after the open, but the major averages spent much of the morning in negative territory as mega-cap and tech stocks, which were responsible for yesterday’s advance, meandered lower.
The Vanguard Mega Cap Growth ETF (+0.3%) finished with a modest gain, but the top-weighted information technology sector (+0.8%) charted a firmly higher course and pushed the major averages back into positive territory just before midday.
Software stocks extended this week’s advance, with the iShares GS Software ETF finishing 1.7% higher. Microsoft (MSFT 420.26, +9.04, +2.20%) was the only “magnificent seven” name to finish with a gain of 1.0% or wider.
While the PHLX Semiconductor Index (+1.0%) captured a more modest gain, its reversal into positive territory played a key role in moving the major averages off their session lows. Advanced Micro Devices (AMD 278.26, +20.14, +7.80%) delivered another strong performance, extending its month-to-date gain past 34% as the stock continues to rebound from recent lows against a backdrop of positive analyst chatter.
Although it is not a component of the S&P 500, Taiwan Semiconductor Manufacturing (TSM 363.34, -11.76, -3.14%) traded lower after topping earnings estimates but guiding Q2 revenues below consensus. However, the company’s CEO noted on its earnings call that the company continues to see robust AI-related demand.
Outside of the technology sector, participation was broader than yesterday’s action, with seven S&P 500 sectors finishing higher. The energy sector (+1.6%) captured the widest gain as crude oil futures settled today’s session $3.41 higher (+3.7%) at $94.71 per barrel. The higher price of oil weighed on some oil-sensitive pockets of the market, such as airlines and cruise lines, which contributed to weakness in the industrials (-0.5%) and consumer discretionary (-0.2%) sectors.
However, the current geopolitical backdrop remains generally constructive, with President Trump announcing a 10-day ceasefire between Israel and Lebanon and noting that talks with Iran will “probably” resume over the weekend.
Elsewhere, the defensive utilities (+0.7%) and consumer staples (+0.3%) sectors finished higher after facing pressure in previous sessions as growth-oriented stocks outperformed. Investors reacted positively to PepsiCo’s (PEP 158.35, +3.50, +2.26%) earnings report, which saw the company top estimates and reaffirm its FY26 guidance.
Those rotational gains across defensive sectors were not extended to the health care sector (-0.8%). The sector faced weakness across medical specialty names after Abbott Labs (ABT 95.46, -6.10, -6.01%) beat earnings and revenue expectations but issued below-consensus guidance for Q2 and FY26.
Charles Schwab (SCHW 92.59, -7.68, -7.66%) was the only stock to finish with a wider loss after announcing Schwab Crypto, a spot crypto trading platform with a flat 75 basis point fee that is viewed as a disruptive, lower-cost alternative to existing crypto-native platforms.
Overall, today’s session underscored the recent improvement in sentiment across equities, leaving the market comfortable enough to extend into record territory. While the gains were modest in comparison to recent sessions, investors were quick to buy this morning’s dip in mega-cap and tech names, which helped the Nasdaq Composite notch its 12th consecutive higher finish.
Looking ahead, attention will center on whether this improved tone can translate into a more durable broadening of participation, particularly beyond mega-cap and technology leadership. Investors will also be focused on whether the market can maintain its current earnings growth projections as Q1 earnings season progresses.
U.S. Treasuries faced some more pressure on Thursday, lifting the 30-yr yield toward this week’s high (4.944%) while yields on shorter tenors returned to their opening levels from Tuesday. The 2-year note yield settled up one basis point to 3.78%, and the 10-year note yield settled up three basis points to 4.31%.
BENCHMARK INDICES YEAR-TO-DATE
- Russell 2000: +9.6% YTD
- S&P Mid Cap 400: +8.2% YTD
- Nasdaq Composite: +3.7%
- S&P 500: +2.9%
- DJIA: +1.1%
MARKET INTERNALS
- DOW closed higher at 48578 (+0.24%).
- Nasdaq closed higher at 24102 (+0.36%).
- S&P 500 closed higher at 7041 (+0.26%).
- Action came on lower than average volume for NYSE but higher for Nasdaq (NYSE 1,186 mln vs avg. of 1,409 mln; NASDAQ 10,048 mln vs avg. of 9,207 mln),
- Advancing/declining volume for NYSE (679 mln/494 mln) and Nasdaq (5715 mln/4186 mln).
- Advancers led decliners (NYSE 1381/1360; NASDAQ 2564/2286)
- New 52-week highs outpacing new 52-week lows (NYSE 79/11, NASDAQ 277/60).
After-Hours Action
US stock futures were little changed on Friday after US President Donald Trump signaled optimism over a potential agreement to end the conflict with Iran, saying Tehran had accepted terms it has long resisted. Trump also announced a 10-day ceasefire between Israel and Lebanon, later confirmed by Israeli Prime Minister Benjamin Netanyahu. In regular trading on Thursday, the S&P 500 and Nasdaq Composite rose 0.26% and 0.36%, respectively, with both benchmarks closing at fresh record highs, while the Dow added 0.24%. Seven of the 11 S&P sectors finished higher, led by gains in energy, real estate, and technology. In corporate developments, Netflix shares fell nearly 10% in extended trading after the company issued a soft second-quarter outlook and said co-founder and chairman Reed Hastings would step down from the board in June.
After Hours Gainers:
Companies trading higher in after hours in reaction to earnings/guidance: CNS +0.6%, WAFD +0.1%
Companies trading higher in after hours in reaction to news: BZAI +26.6% (new contract with NeoTensr to generate up to $50 mln in revs in first year), NI +2.4% (new long-term energy agreement with a subsidiary of Alphabet), RDNT +2% (GEHC expands mammography collaboration with RadNet’s DeepHealth subsidiary), GEHC +1.1% (GEHC expands mammography collaboration with RadNet’s DeepHealth subsidiary), BVN +0.9% (Q1 operations report), SCSC +0.8% (advances converged communications strategy with dedicated CX team and Arrow McLaren partnership), CSWC +0.8% (expects Q4 net investment income of $0.59-0.60/sh), ASTS +0.1% (BlueBird 7 to launch on April 19), WFG +0.1% (provides update on US Dept of Commerce softwood lumber duties)
After Hours Losers:
Companies trading lower in after hours in reaction to earnings/guidance: NFLX -9.1%, AA -3.6%, KNX -2.8%
Companies trading lower in after hours in reaction to news: TRVI -8.5% (commences $150 mln common stock offering), CENX -0.9% (commences expanded production at Mt. Holly smelter), DNUT -0.8% (expansion into the Netherlands), GTLB -0.2% (releases GitLab 18.11), RTX -0.2% (awarded a $904.6 mln modification to US Army contract)
BONDS AND YIELDS
U.S. Treasuries faced some more pressure on Thursday, lifting the 30-yr yield toward this week’s high (4.944%) while yields on shorter tenors returned to their opening levels from Tuesday. The market attempted to recover yesterday’s losses during the first few minutes of action, but it found resistance just an hour after the start, spending the remainder of the session in a slow retreat. The retreat was paced by the long bond, lifting its yield toward this week’s high from Monday while yields on shorter tenors finished a bit below this week’s highs. The intraday selling took place as oil reclaimed a portion of its loss from the past two days amid some focus on a Bloomberg report that unnamed officials in European and Gulf state governments believe that a peace deal with Iran could take six months to complete. Economic data released today included another low weekly initial claims reading (207,000) and a strong Philadelphia Fed Index (26.7; Briefing.com consensus 12.7), countered by a disappointing Industrial Production report for March (-0.5%; Briefing.com consensus 0.1%). Overseas, China reported in-line GDP growth for Q1 (1.3% qtr/qtr) while the U.K. reported strong growth for February (0.5% m/m; expected 0.1%). Crude oil climbed toward $95/bbl while the U.S. Dollar Index rose 0.1% to 98.19.
Yields
- 2-yr: +1 bp to 3.78%
- 3-yr: +2 bps to 3.80%
- 5-yr: +2 bps to 3.91%
- 10-yr: +3 bps to 4.31%
- 30-yr: +4 bps to 4.93%
CURRENCIES
The dollar index edged up above 98 on Thursday but remained near the pre-war lows seen in the previous session, as investors grew increasingly optimistic that the US and Iran could soon reach an agreement to end the conflict and reopen the Strait of Hormuz, reducing safe-haven demand. US President Trump said the seven-week conflict was “close to over,” while the White House expressed confidence in a potential deal, noting that additional in-person talks could take place in Pakistan. However, Iranian officials signaled that significant differences remain, particularly regarding nuclear issues. Meanwhile, softer crude prices in recent days have helped ease inflation concerns. The Federal Reserve is widely expected to keep interest rates on hold throughout the year, a view reinforced by recent comments from several policymakers, including Federal Reserve Bank of New York President John Williams.
Currencies
- EUR/USD: -0.1% to 1.1782
- GBP/USD: -0.2% to 1.3532
- USD/CNH: +0.1% to 6.8220
- USD/JPY: +0.2% to 159.17
Aussie Dollar Sits at 4-Year Top
The Australian dollar held above $0.71, sitting near its highest level since May 2022 and headed for its third straight weekly gain, supported by improving risk sentiment amid hopes for a potential de-escalation in the Middle East war. US President Trump continued to signal progress toward a deal with Iran, though the key details remain unconfirmed and the Strait of Hormuz continues to face disruptions, keeping energy prices volatile. Still, the Aussie has rebounded sharply amid the optimism, up over 5% from late-March lows triggered by the geopolitical tensions. Meanwhile, Australia’s labor market remained resilient in March, reinforcing bets that the Reserve Bank may continue tightening policy. Markets currently price in a 70% odds of a third consecutive rate hike in May, with upcoming Q1 inflation data seen as critical for the outlook. Adding support, solid first-quarter growth in China, driven by exports and policy support, has bolstered demand prospects for Australian commodities.
Euro at Pre-War Levels
The euro hovered near $1.18, holding close to its pre-war highs, supported by broad-based dollar weakness as investors grow more optimistic that diplomatic efforts could bring an end to the US–Iran conflict. Reports indicate that both sides are considering a two-week extension of the ceasefire to allow additional time for negotiations, with a second round of talks expected in the near term. In this context, oil prices have eased from recent peaks, helping to alleviate inflationary pressures and prompting traders to scale back expectations for near-term monetary tightening by the ECB. Markets are now pricing in two 25 basis point rate hikes this year, down from three anticipated just a few weeks ago. Earlier in the week, ECB President Lagarde acknowledged that elevated energy costs have diverted the eurozone from its baseline economic trajectory, but she refrained from signaling any imminent rate increases.
Sterling Eases from 8-Week High
The British pound eased to around $1.356 as traders scaled back expectations for a Bank of England rate hike, supported by growing optimism that the Middle East conflict may be nearing an end. Policymakers have signaled no urgency to tighten policy, with Governor Andrew Bailey saying it is too early to assess the war’s impact, describing it as a major energy shock whose duration will shape inflation. Also, policymaker Megan Greene said markets were right to dial back aggressive rate hike expectations. The conflict is expected to weigh heavily on the UK economy, lifting borrowing costs and inflation while dampening growth prospects ahead of the April 30 policy meeting. Despite this, recent data showed strong momentum before the war, with GDP rising 0.5% in February. Sterling remains near an eight-week high and is up about 2.6% in April on hopes of a peace deal.
Offshore Yuan Hits Over 3-Year High
The offshore yuan edged higher to above 6.81 per USD, hitting its highest in more than three years as stronger-than-expected growth in China’s economy boosted sentiment. The world’s second-largest economy grew 0.5% in the first quarter from a year ago, accelerating from the 4.5% gain in the prior quarter and beating forecasts. However, signs of weakness started to emerge as the war in Iran disrupted global supply chains. March activity data showed a mixed backdrop, with industrial output rising 5.7% but slowing from earlier in the year, while retail sales increased 1.7%, missing expectations and easing from the previous period. This followed recent trade data, which highlighted a severe cooling in China’s export growth, indicating that the ongoing Middle East war may be dragging down global demand. Meantime, the US and Iran are considering extending their two-week ceasefire to allow more time for talks, even as the Strait of Hormuz remains effectively closed under a dual blockade.
COMMODITIES
Brent crude futures slipped toward $98 per barrel and WTI crude futures slipped toward $93 per barrel on Friday, trimming gains from the previous session after US President Donald Trump voiced optimism about a possible agreement to end the conflict with Iran. He said Tehran had accepted terms that include abandoning ambitions for a nuclear weapon, providing “free oil,” and reopening the Strait of Hormuz, though Iranian authorities have yet to confirm the claims. Trump also announced a 10-day ceasefire between Israel and Lebanon, which was confirmed by Israeli Prime Minister Benjamin Netanyahu. Meanwhile, the Strait of Hormuz remains effectively closed due to a dual blockade by the US and Iran, keeping markets on edge over further disruptions to global energy flows. Meanwhile, IMF Executive Director Fatih Birol warned that restoring a meaningful portion of disrupted oil and gas output could take up to two years.
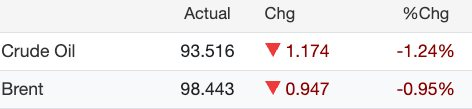
The spread between Brent and WTI is currently at $4.93
Commodities
- Crude Oil +3.41 @ 94.71
- Nat Gas +0.04 @ 2.65
- Gold -17.80 @ 4805.80
- Silver -0.95 @ 78.69
- Copper unchanged @ 6.08
Silver Set for Fourth Weekly Gain
Silver held steady near $79 an ounce on Friday and was on track for a fourth consecutive weekly advance, as prospects for a permanent ceasefire agreement between the US and Iran helped ease concerns over inflation and central bank rate hikes. President Donald Trump said Tehran had agreed to terms including abandoning ambitions for a nuclear weapon, supplying “free oil,” and reopening the Strait of Hormuz, although Iranian officials have yet to verify these claims. Despite this, the Strait of Hormuz remains effectively closed under a dual blockade, while IMF Executive Director Fatih Birol cautioned that restoring a meaningful portion of disrupted oil and gas output could take up to two years. Even so, oil prices have retreated sharply amid growing optimism over a potential Iran deal, easing inflationary pressures and dampening expectations of further rate hikes. Silver is set to rise by about 4% this week and was nearly 30% above its March low.
Gold Poised for Fourth Weekly Gain
Gold held steady near $4,800 an ounce on Friday and was on track for a fourth consecutive weekly advance, as prospects for a permanent ceasefire agreement between the US and Iran helped ease concerns over inflation and central bank rate hikes. President Donald Trump said Tehran had agreed to terms including abandoning ambitions for a nuclear weapon, supplying “free oil,” and reopening the Strait of Hormuz, although Iranian officials have yet to verify these claims. Despite this, the Strait of Hormuz remains effectively closed under a dual blockade, while IMF Executive Director Fatih Birol cautioned that restoring a meaningful portion of disrupted oil and gas output could take up to two years. Even so, oil prices have retreated sharply amid growing optimism over a potential Iran deal, easing inflationary pressures and dampening expectations of further rate hikes. Gold is set to rise by about 1% this week and remains roughly 17% above its March low.
Copper Extends Gains on Mideast Optimism
Copper futures rose to around $6.1 per pound on Thursday, extending gains for a fifth consecutive session to reach their highest level since late January, as easing concerns over the Middle East conflict supported expectations for steadier global growth and industrial demand. Reports indicated Washington and Tehran are considering extending their two-week ceasefire to allow additional time for negotiations, even as the Strait of Hormuz remains effectively closed under a dual blockade. Market attention has now shifted to a potential second round of US-Iran talks, expected to focus on reopening the strait and addressing Iran’s nuclear enrichment program. Copper prices also found support from firmer demand signals in China, where data showed March imports of copper ore and concentrate rose 6.6% year-on-year. Chinese fabricators were also reported to have increased purchases, taking advantage of recent price softness.

Baltic Dry Index Rises to Over 4-Month High
The Baltic Exchange dry bulk freight index rose 1.6% to 2,523 on Thursday, reaching its highest level since December 9, 2025 and marking a tenth consecutive day of gains. The capesize index, which tracks vessels carrying around 150,000 tons such as iron ore and coal, climbed 1.6% to 4,026, its highest in over four months. The panamax index, covering ships that transport 60,000 to 70,000 tons of coal or grain, increased 1.1% to 1,970, the strongest level since early March. Meanwhile, the supramax index gained nearly 2% to 1,398.

Palm Oil Prices Stay Below MYR 4,500 on Weak Demand
Malaysian palm oil futures held below MYR 4,500 per tonne, hovering near a five-week low, as weak exports weighed on sentiment. Cargo surveyors estimated April 1–15 shipments plunged over 34% mom, reflecting the absence of festive demand. So far this week, contracts logged a second straight weekly decline, pressured by uncertainty over U.S.–Iran talks to end the Middle East conflict. Still, the downside was cushioned by firmer edible oil prices in Dalian and Chicago markets, alongside expectations that India, the top consumer, may boost purchases ahead of seasonal demand after March imports fell 19% to a three-month low. On the supply side, Malaysia’s inventories dropped for a third month to a seven-month low in March. Kuala Lumpur is also considering expanding biodiesel use to ease fuel strains amid the crisis. In key buyer China, solid Q1 2026 GDP growth lent support, though momentum may weaken as demand-supply imbalances and fragile external conditions persist.
ROTW UPDATES
Equity indices in the Asia-Pacific region had a generally positive showing with Japan’s Nikkei (+2.4%) rallying to a fresh record high while South Korea’s Kospi (+2.2%) approached its record from late February.
- Japan’s Nikkei: +2.4%,
- Hong Kong’s Hang Seng: +1.7%,
- China’s Shanghai Composite: +0.7%,
- India’s Sensex: -0.2%,
- South Korea’s Kospi: +2.2%,
- Australia’s ASX All Ordinaries: -0.1%.
In news:
- China’s President Xi pledged to increase cooperation with Russia after meeting with Russia’s Foreign Minister Lavrov.
- Russia’s President Putin is expected to visit China in late May.
- China’s Q1 GDP was in line with expectations, but Retail Sales growth in March decelerated to its slowest pace since December.
- Australia saw in-line job growth in March.
In economic data:
- China’s Q1 GDP 1.3% qtr/qtr, as expected (last 1.2%); 5.0% yr/yr (expected 4.8%; last 4.5%). March Fixed Asset Investment 1.7% yr/yr (expected 1.9%; last 1.8%), March Industrial Production 5.7% yr/yr (expected 5.4%; last 6.3%), March House Prices -3.4% yr/yr (last -3.2%), and March Retail Sales 1.7% yr/yr (expected 2.4%; last 2.8%)
- Australia’s April MI Inflation Expectations 5.9% (last 5.2%). March Employment Change 17,900 (expected 19,100; last 49,700) and full Employment Change 52,500 (last -27,700). March Unemployment Rate 4.3%, as expected (last 4.3%), and March Participation Rate 66.8% (expected 66.9%; last 66.9%)
Major European indices trade in the green.
- STOXX Europe 600: +0.3%,
- Germany’s DAX: +0.5%,
- U.K.’s FTSE 100: +0.6%,
- France’s CAC 40: +0.5%,
- Italy’s FTSE MIB: +0.4%,
- Spain’s IBEX 35: +0.2%.
In news:
- The U.K. reported strong growth for February, prompting an opinion from Deutsche Bank that Q1 growth could be well ahead of expectations.
- However, Gilt yields are lower this morning, suggesting the market believes the strength is temporary.
- European Central Bank officials are reportedly skeptical about an April rate hike due to little evidence of knock-on effects from the energy price spike.
- The European Banking Authority noted that private credit does not pose a systemic risk to banks in the EU.
In economic data:
- Eurozone’s March CPI 1.3% m/m (expected 1.2%; last 0.6%); 2.6% yr/yr (expected 2.5%; last 1.9%). March Core CPI 2.3% yr/yr, as expected (last 2.4%) o U.K.’s February GDP 0.5% m/m (expected 0.1%; last 0.1%), February Manufacturing Production -0.1% m/m (expected 0.3%; last 0.2%); -0.5% yr/yr (expected -0.3%; last 1.3%). February Industrial Production 0.5% m/m (expected 0.3%; last -0.1%); -0.4% yr/yr (expected -0.9%; last 0.5%). February Construction Output 1.0% m/m (expected -0.4%; last 0.5%); -1.0% yr/yr (expected -0.4%; last -1.9%). February trade deficit GBP18.79 bln (expected deficit of GBP19.40 bln; last deficit of GBP15.08 bln)
- Italy’s March CPI 0.5% m/m, as expected (last 0.7%); 1.7% yr/yr, as expected (last 1.5%)
- Swiss March PPI 0.2% m/m (expected 0.5%; last -0.3%); -2.7% yr/yr (last -2.7%)
U.S. ECONOMIC UPDATES
- April Philadelphia Fed Index 26.7 (Briefing.com consensus 12.7); Prior 18.1
- Weekly Initial Claims 207K (Briefing.com consensus 215K); Prior was revised to 218K from 219K, Weekly Continuing Claims 1.818 mln; Prior was revised to 1.787 mln from 1.794 mln
- The key takeaway from the report is that it refutes any notion that the labor market is cracking in a way that will lock up discretionary spending. Initial jobless claims—a leading indicator—continue to run at historically low levels.
- March Industrial Production -0.5% (Briefing.com consensus 0.1%); Prior was revised to 0.7% from 0.2%, March Capacity Utilization 75.7% (Briefing.com consensus 76.4%); Prior was revised to 76.1% from 76.3%
- The key takeaway from the report is that the headline decline is not as bad as it looks when taking into account the large upward revision to industrial production in February, which effectively offsets the decline in March.
- Pakistan is pushing for a longer ceasefire between the U.S. and Iran so there can be more time to negotiate a larger peace deal, according to Boomberg
- Israel and Lebanon could announce a ceasefire soon, according to FT
- CNBC International Correspondent Dan Murphy says there is a sense this is the beginning of the end of the Iran war; says U.S. blockade working “very well”; says diplomacy is moving because of the U.S. blockade; says economic pressure on Iran is building by the hour; says Iran’s currency is “effectively worthless” as a store of value and Iran is looking for an off-ramp
- Senator Thom Tillis repeated that he would not vote to confirm Kevin Warsh until the Trump administration ends its federal criminal probe into the Fed, according to NBC News
- The U.S. is close to becoming net crude exporter for the first time since World War 2, according to Reuters
- China Q1 GDP was 5.0% yr/yr versus 4.5% prior
- EU working on jet fuel supply plan, according to Reuters
- The Pentagon asked automakers and manufacturers to increase weapons production, according to WSJ
- EU Commission updates EU competition rules for technology licensing agreements
US 30-Year Mortgage Rates Drop For 2nd Week
US Mortgage rates fell for the second straight week, averaging 6.30% as of April 16, down from 6.37% last week, easing borrowing costs during the peak homebuying season. Rates hit a one-month low amid easing geopolitical fears and a record S&P 500, as strong bank and tech earnings overshadowed Middle East tensions. Refinance activity rose, per the Mortgage Bankers Association, while purchase applications stayed subdued, remaining below year-ago levels for the second week, as buyers remained cautious amid economic uncertainty.
US Capacity Utilization Falls Below Expectations
US capacity utilization fell to 75.7% in March 2026, down from a downwardly revised 76.1% in February and below market expectations of 76.3%. The rate stands 3.7 percentage points below its long-run average for 1972–2025, with declines broad-based across sectors. The utilities sector saw the sharpest drop, with its operating rate falling to 70.3%, 13.7 percentage points below its historical average. Manufacturing utilization edged down to 75.3%, leaving it 2.9 percentage points below average, while mining utilization declined to 84.5%, or 0.7 percentage points below its long-run average.
US Manufacturing Output Falls in March
Manufacturing output in the United States decreased 0.1% month-over-month in March 2026, missing market expectations for a 0.1% gain and after moving up 0.4% in February. In March, a decrease of 0.2% in the production of durable goods reflected weaker output of motor vehicles and parts, which fell 3.7%, as well as declines in the output of primary metals, machinery, and furniture and related products. Nondurable manufacturing output edged down 0.1%, with more industry groups posting losses than posting gains. In particular, only the indexes for petroleum and coal products, for plastics and rubber products, and for paper increased, while all other nondurable indexes decreased.
US Industrial Production Unexpectedly Falls
Industrial production in the United States dropped 0.5% month-over-month in March 2026, missing market expectations for a 0.1% gain and after moving up 0.7% in February. It marks the biggest fall in industrial activity since September 2024. Manufacturing output, which makes up about 78% of total industrial production, decreased 0.1% after an upwardly revised 0.4% increase in February and also missing forecast of a 0.1% gain. Mining output fell 1.2% in March. The index for utilities contracted 2.3%, with reductions in the output of both electric and natural gas utilities. Capacity utilization receded to 75.7 percent, a rate that is 3.7 percentage points below its long-run (1972–2025) average.
Philadelphia Factory Activity Unexpectedly Rises
The Philadelphia Fed Manufacturing Index climbed to 26.7 in April 2026 from 18.1 in the prior month, hitting its strongest level since January 2025. The data surprised analysts on the upside, comfortably exceeding expectations for a drop to 10. The current shipments index rose 12 points to 34.0, while the index for current new orders jumped 24 points to 33.0. Meanwhile, the employment index fell 6 points to -5.1 in April. Both price indexes increased for the second month, continuing to run well above their long-term averages and marking their highest levels since August. The prices paid index rose 15 points to 59.3 in April, while the current prices received index rose 12 points to 33.5. Looking forward, the firms continue to expect overall growth over the next six months, although most future indicators have moved down.
NY Services Activity Contraction Eases in April
The Federal Reserve Bank of New York’s general business activity index, which tracks economic activity in New York State as well as parts of New Jersey and Connecticut, rose nine points to -14 in April 2026. Twenty-four percent of respondents reported that conditions improved over the month while 38 percent said that conditions worsened. The business climate index ticked down three points to -49.3, suggesting the business climate remained much worse than normal. Employment edged slightly lower and supply availability worsened significantly. The pace of input price increases accelerated sharply, while selling price increases picked up modestly. Looking ahead, firms expect little improvement in the next six months.
US Initial Claims Below Forecasts, Continuing Jump
The number of people claiming for unemployment benefits in the US fell to 207K in the week ended April 11th 2026 from a downwardly revised 218K in the previous week which was the highest value since early February. The figure came in below forecasts of 215K, marking the largest weekly decline since February and signaling that layoffs remain limited, as both the labour market and the broader economy continue to demonstrate resilience. The 4-week moving average which excludes week-to-week volatility was 209,750, an increase of 500 from the previous week’s revised average of 209.25K. Meanwhile, continuing claims which are seen as a proxy for the number of people receiving unemployment benefits, went up to 1818K in the week ended April 4th, an increase of 31K from the previous week’s revised level.
EARNINGS SEASON AND GUIDANCE
- Abbott Labs (ABT) beats by $0.01, beats on revs; guides Q2 EPS below consensus; guides FY26 EPS below consensus
- Allstate (ALL) discloses estimated catastrophe losses for the month of March of $925 million or $731 million, after-tax, from 15 wind and hail events with approximately 80% of the losses related to three events
- Americas Silver (USAS) announces new record quarterly silver production and sales, including 787,000 ounces produced and 830,000 ounces sold
- Avino Silver & Gold (ASM) reports consolidated mineral reserves
- BNY Mellon (BK) beats by $0.30, beats on revs
- BW LPG Ltd (BWLP) reports Q1 profit in product services segment
- Charles Schwab (SCHW) beats by $0.03, reports revs in-line
- Citizens Financial Group (CFG) beats by $0.04, reports revs in-line; provides Q2 guidance
- Corebridge Financial (CRBG) estimates quarterly variable investment income will be approximately $15-25 mln (pre-tax)
- Exelon (EXC) also reaffirms 2026 adj EPS guidance and 2025-2029 op earnings to be near the top end of the 5-7% range
- Home Bancshares (HOMB) beats by $0.01, misses on revs
- Insteel Industries (IIIN) misses by $0.37, misses on revs
- J.B. Hunt Transport (JBHT) beats by $0.05, beats on revs
- KeyCorp (KEY) beats by $0.03, reports revs in-line
- Manpower (MAN) beats by $0.02, beats on revs; mid-point of Q2 EPS guidance above consensus
- Marsh McLennan (MRSH) beats by $0.07, beats on revs
- PepsiCo (PEP) beats by $0.07, beats on revs; reaffirms FY26 EPS guidance, revs guidance
- PPG Industries (PPG) issues upside Q1 EPS guidance and announces a global price adjustment across its paints, coatings and specialty products portfolio
- Prologis (PLD) beats by $0.01, reports revs in-line; raises FY26 core FFO guidance
- QuidelOrtho (QDEL) guides Q1 revenue below conesnsus; believes low end of 2026 guidance remains achievable
- Rentokil Initial plc (RTO) reports Q1 revenue growth; maintains FY outlook
- SL Green Realty (SLG) misses by $0.24, beats on revs; reaffirms FY26 FFO guidance
- Taiwan Semiconductor Manufacturing (TSM) beats by $0.19, beats on revs; guides Q2 revs above consensus
- TotalEnergies (TTE) reports Q1 main indicators
- Travelers (TRV) beats by $0.64, misses on revs; raises dividend
- U.S. Bancorp (USB) beats by $0.04, reports revs in-line; guides FY26 revs in-line
- Westamerica Bancorporation (WABC) reports first quarter 2026 financial results
2026 APR 17
Pre-Market: ALLY ALV BMI ERIC FITB RF STT TFC
After-Hours: None
THE WEEK AHEA
WEEK 16: MONDAY TO FRIDAY, APRIL 13 to APRIL 17
According to the PTSD*, Week 16 has FIVE trading days and is the THIRD trading week in April 2026. 17th April is Expiration Friday. The next Market Holiday is on MONDAY MAY25. Seasonally, Week 16 has a Bullish outlook. April is the last of the “6 months of bullishness” on the SPX.
We also need to keep in mind that with the current POTUS, seasonals can easily go out of whack.
*PTSD – Penguin Trader Seasonal Data.
BENCHMARK INDICES (21-YEAR AVERAGE)
The Stock Trader’s Almanac’s stats for the Benchmark Indices for 2026 APRIL XX of Week 16 over a 21-year average are:
- Dow Jones (DJIA):61.9%
- S&P 500 (SPX):66.7%
- NASDAQ (COMP):66.7%
- *Russells 2000 (RUT):64.7%
*The RUT is not listed in the STA; several penguins with a slide ruler calculated the 21-year average.
BENCHMARK INDEX ETFs
The Penguin Trader Seasonal Data (PTSD) stats for the Benchmark Index ETFs for 2026 APRIL XX of Week 16 over a 15-year average are:
- DIA – (15yr Avg): 40.0%
- SPY – (15yr Avg): 46.7%
- QQQ – (15yr Avg): 46.7%
- RUT – (15yr Avg): 33.3%
ECONered for this post soon, or if incentivised with enough cheese.
COMMENTARY
It is Expieration Friday tonight. The Markets have been behaving in line with the seasonals. Weeks 16 and 17 have been historically the most bullish weeks of the year.
I do believe that the bullishness is currently just pent-up frustrations being released, rather than alignment with the seasonals. The war and the traffic jam is still kinda going on, just that the media is playing out another story now.
On the home front, my SPX IC is in a very concerning position, as SPX has surpassed 7,000. In retrospect, I should have just closed this position when it went into negative days back. Another lesson. Thoughts currently is that I can now wait it out, as my short legs are still ITM, I got more than 10 days, and the momentum has started to show bearish signs. But week 17 is next week – another bullish week. I should have taken this into account before opening this spread.
Stay Hedged – My Penguin Friends
(Excerpts from briefing.com, tradingeconomics.com, financialscents.com, factset.com, finviz.com, marketwatch.com, etrade.com, yahoo.com, tigerbrokers.com, tradingview.com, tradingcentral.com, theedgemalaysia.com, sectorspdrs.com, Investopedia.com, and CNBC.com)